HbA1c vs. Blood Glucose: How Glycemic Control Actually Works
Understand the difference between daily blood sugar fluctuations and the 3-month average HbA1c panel. Includes an interactive estimated average glucose converter.
When managing diabetes or reviewing metabolic wellness, you will repeatedly meet two numbers: blood glucose and HbA1c (glycated haemoglobin). Both measure sugar, but they answer completely different questions about the same body.
The snapshot versus the film
A finger-prick glucose test or a continuous glucose monitor reading is a momentary snapshot. It moves within minutes in response to a meal, a walk, a bad night of sleep, an infection, or a dose of insulin. Two readings taken an hour apart can look like they belong to different people.
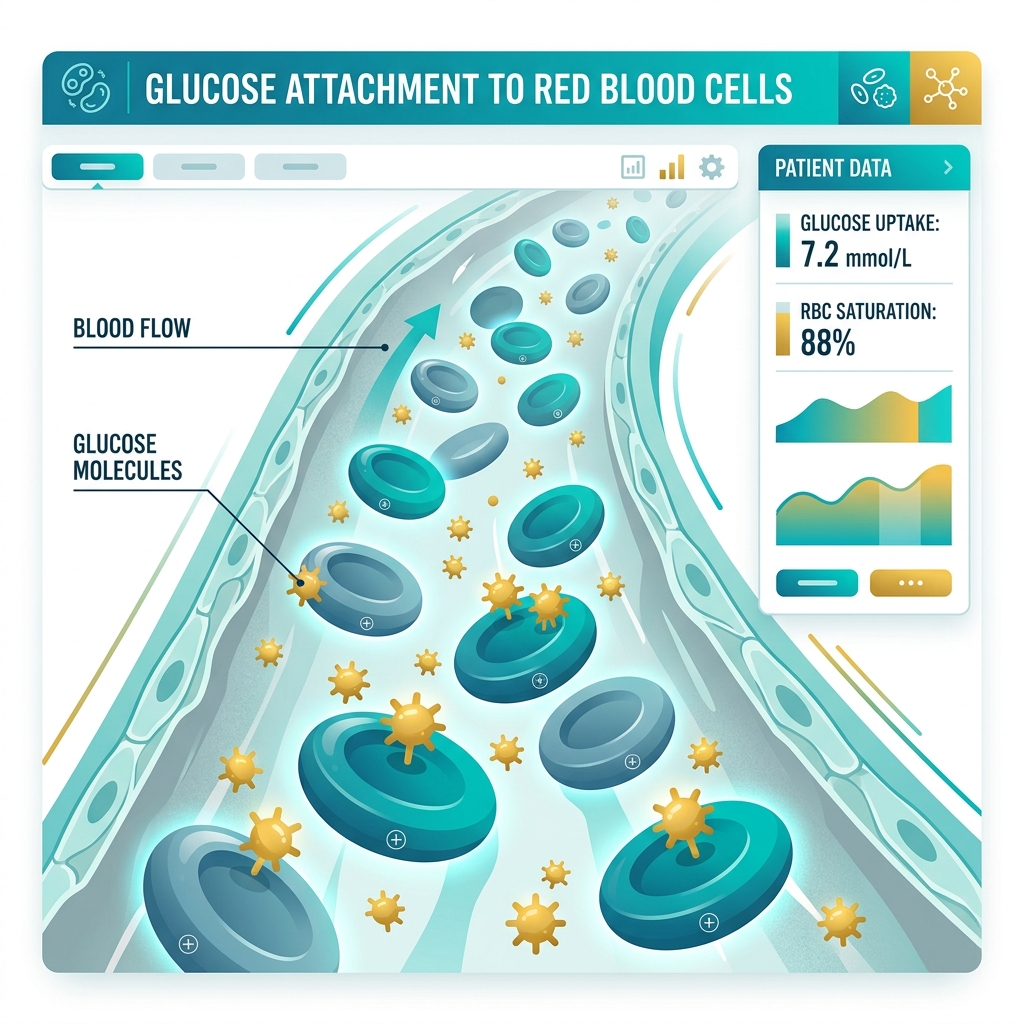
HbA1c behaves like a three-month film instead. Red blood cells live roughly 120 days, and while they circulate, glucose attaches to the haemoglobin inside them — a slow, essentially irreversible process called glycation. The proportion of haemoglobin carrying that sugar tracks the average glucose the cells were bathed in over their lifespan.
Because older cells have had longer to glycate and are steadily being replaced, the most recent four to six weeks influence the result more than the first month does. HbA1c is an average, but a weighted one.
Published interpretation thresholds
The World Health Organization and the American Diabetes Association publish these diagnostic bands:
| Band | HbA1c | Roughly equivalent average glucose |
|---|---|---|
| Normal | Below 5.7% | Under ~117 mg/dL |
| Prediabetes range | 5.7% – 6.4% | ~117 – 137 mg/dL |
| Diabetes range | 6.5% and above | ~140 mg/dL and above |
These are population thresholds used for classification, not personal targets. Treatment goals are set individually by a doctor and are frequently different from the diagnostic cut-off.
Interactive HbA1c to Average Glucose Converter
CLINICAL TOOL125 mg/dL
6.9 mmol/L
Prediabetic Range
Why both numbers are ordered
HbA1c alone can hide glycaemic variability — the swings inside a single day. Someone can hold an HbA1c of 6.0% while regularly experiencing both hypoglycaemic lows and post-meal spikes, because an average absorbs both. Daily readings show the shape of the day; HbA1c shows the level of the season.
When HbA1c is less reliable
The test assumes red blood cells live a normal lifespan. Anything that shortens or lengthens it distorts the result, which is why laboratories and clinicians treat HbA1c cautiously alongside:
- Anaemia, especially iron-deficiency and haemolytic anaemia
- Recent blood transfusion or significant blood loss
- Haemoglobin variants such as HbS or HbE, common in parts of India
- Chronic kidney or liver disease
- Pregnancy, where red cell turnover changes across trimesters
Reference ranges for these markers
Open the library entry for the published range, sample type, and citations.
Keep your own results in one place
File the reports behind these numbers under each family member and watch repeat values build into a trend. Free to start.
Educational content only. This article describes what a test measures and how published reference ranges are defined. It is not a diagnosis, does not interpret your personal results, and is not a substitute for a qualified doctor. Reference thresholds cited are those published by bodies such as the WHO, NIH, and CDC, and can differ between laboratories.