Lipid Panels Explained: The Truth About LDL and HDL Cholesterol
Demystify your heart health readings. Learn about cardiovascular plaque risk, HDL/LDL ratios, and how statin therapies reduce cholesterol indicators.
High cholesterol is often described as silent because it produces no symptoms while contributing to cardiovascular risk over years. The lipid panel is the standard way that risk is measured. Here is what sits on it.
Cholesterol does not travel alone
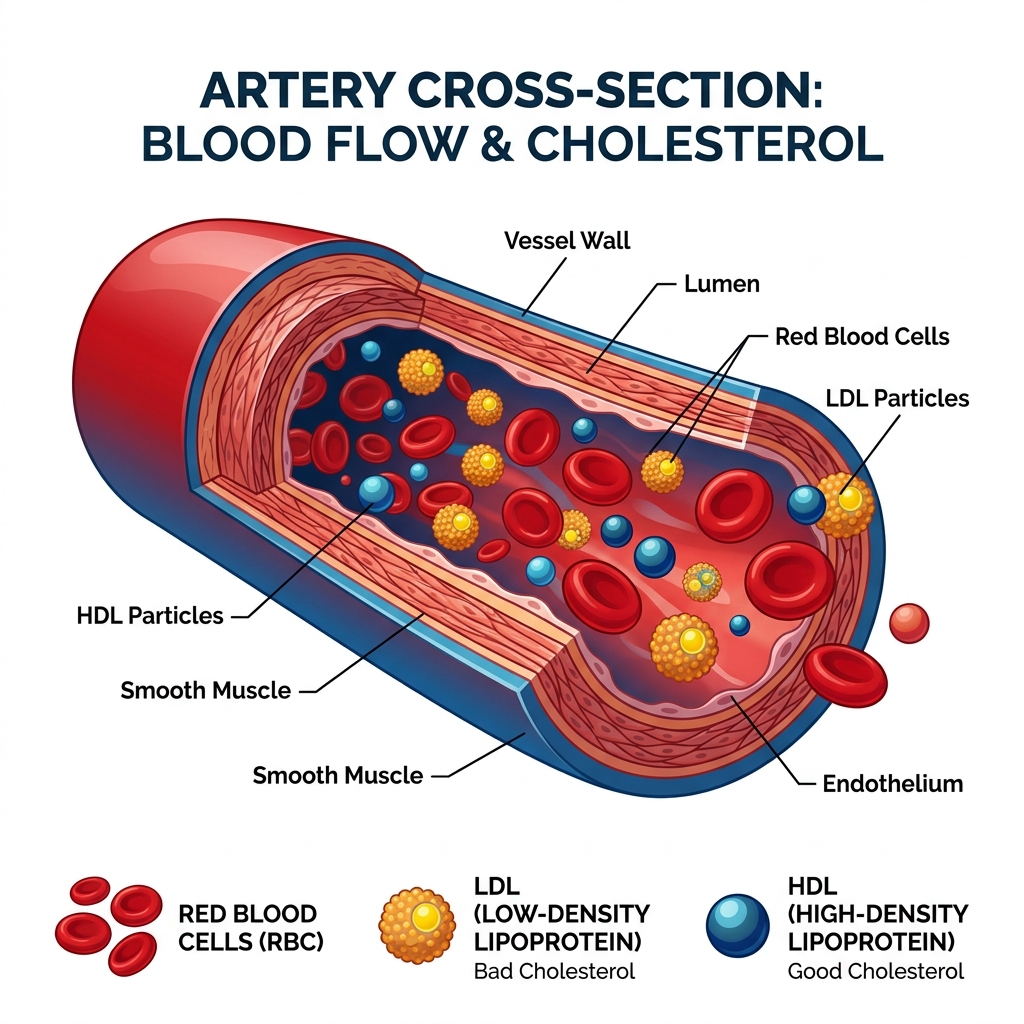
Cholesterol is a fat and blood is largely water, so it cannot circulate freely. It is packaged into lipoproteins — protein-wrapped particles that act as transport containers. Everything the panel reports is really about those containers, which is why "LDL cholesterol" means the cholesterol being carried inside LDL particles.
LDL — the delivery direction
Low-density lipoprotein moves cholesterol from the liver out to tissues. When more is circulating than tissues need, LDL particles can lodge in artery walls, where they contribute to the plaque that narrows arteries over time (atherosclerosis). This is the mechanism behind LDL being described as the "bad" fraction.
HDL — the return direction
High-density lipoprotein runs the opposite route, collecting excess cholesterol from tissues and returning it to the liver for disposal. Higher HDL has historically been associated with lower cardiovascular risk, though research has complicated the simple picture that raising it is automatically protective.
Triglycerides and the calculated lines
Triglycerides are the storage fat carried in the blood, and they are the most food-sensitive number on the panel — which is why lipid panels have traditionally been drawn fasting.
Importantly, LDL is often not measured directly. Many laboratories calculate it from the other three values using the Friedewald equation. That calculation becomes unreliable when triglycerides are high, which is one reason a directly measured LDL is sometimes ordered instead.
The total-to-HDL ratio
Clinicians often look at the total cholesterol to HDL ratio because it captures the balance between the two directions of transport in a single figure, which total cholesterol alone cannot do. A lower ratio is generally regarded as more favourable.
Interactive Total Cholesterol to HDL Ratio Calculator
CLINICAL TOOL4.00
Moderate Cardiovascular Risk
Why one panel is rarely enough
- Recent meals move triglycerides substantially, and through them the calculated LDL
- Acute illness or infection can temporarily depress cholesterol readings
- Seasonal and biological variation means repeat panels differ even with no change in health or treatment
- Risk is assessed in context — age, blood pressure, smoking, diabetes, and family history all enter the calculation alongside the lipid numbers
Reference ranges for these markers
Open the library entry for the published range, sample type, and citations.
Keep your own results in one place
File the reports behind these numbers under each family member and watch repeat values build into a trend. Free to start.
Educational content only. This article describes what a test measures and how published reference ranges are defined. It is not a diagnosis, does not interpret your personal results, and is not a substitute for a qualified doctor. Reference thresholds cited are those published by bodies such as the WHO, NIH, and CDC, and can differ between laboratories.